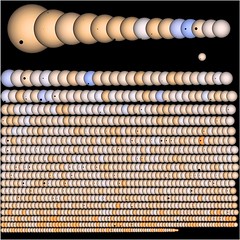
This picture shows every Kepler planetary candidate and its transiting companion in silhouette. The sizes of the stars and transiting companions are properly scaled. The colours of the stars are meant to represent how the eye would see the star outside of the Earths atmosphere. Stars have been properly limb darkened and the companions have been offset to match the modeled impact parameter. Some stars will even show more than one planet!
The largest star is 6.1 times larger that the Sun and the smallest stars are estimated to be only
0.3 times the radius of the Sun. The Sun is shown below the top row on the right by itself with the Earth and Jupiter in transit
Don't forget to check out the high-resolution version, which is necessary to see some of the smallest planetary candidates.
Hi-res: Link
Wednesday, March 23, 2011
Monday, March 09, 2009
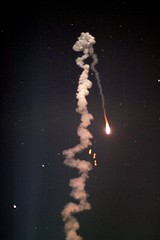
Kepler Launch!
To paraphrase the kiddies of today, "OMG Ponies!!!!"
I got to travel to the Kennedy Space Centre to watch a Delta II launch carrying the Kepler mission. It was a magnificent sight. What shocked me was how bright the it was. Luckily it was a very clear night, so one could see the boosters separate and fall back down to the Earth. You can see them glowing in the picture above.
Way go to Kepler!
Wednesday, September 10, 2008
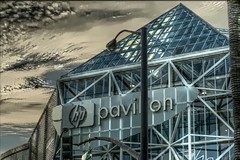
New Building for Burton Meats
Very cool. My parents and brother have moved into a new building. Impressive new place. I especially like the addition of the retail store!
New website is: www.burtonmeats.com

New website is: www.burtonmeats.com
Friday, May 30, 2008
Kepler Bandpass
The transmission functions for the Johnson B,V,R,I filters are shown from left to right in blue, green, red and magenta respectively and have been scaled to peak at 100% transmission. The Kepler bandpass is shown in black which peaks at approximately 70% throughput. The CoRoT whitelight bandpass is shown by the dot-dashed line. The MOST bandpass is shown by the dashed line. The spectrum for an A2V star is shown in cyan, which peaks in the UV and the spectrum for a M2V star is shown in orange which peaks in the infrared. The two spectra have been scaled to have equal flux in the Johnson V filter.
If two stars of two different spectral types have equal brightness in the V filter, then one would like to know what is the difference in flux over the Kepler bandpass for the two stars. One starts by defining that a G2V star will have equal brightness in the V filter and Kepler bandpass. This definition provides a natural way to scale the artificial spectra and to compute the flux difference in the V filter and Kepler bandpass as a function of spectral type. The Figure demonstrates how a hot A2V and cool M2V star with equal brightness in the V filter can have quite different brightnesses through the Kepler bandpass with extends to the near infrared part of the spectrum.

If two stars of two different spectral types have equal brightness in the V filter, then one would like to know what is the difference in flux over the Kepler bandpass for the two stars. One starts by defining that a G2V star will have equal brightness in the V filter and Kepler bandpass. This definition provides a natural way to scale the artificial spectra and to compute the flux difference in the V filter and Kepler bandpass as a function of spectral type. The Figure demonstrates how a hot A2V and cool M2V star with equal brightness in the V filter can have quite different brightnesses through the Kepler bandpass with extends to the near infrared part of the spectrum.
Wednesday, May 28, 2008
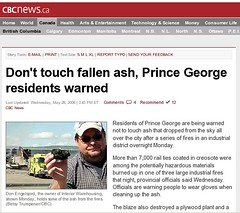
Don't Touch the Ash.
umm.. warning to the people of Prince George not to touch the ash, so CBC shows a picture of a resident holding up ash and posing for a nice photo. I hope his hand is okay.
Original URL: http://www.cbc.ca/canada/british-columbia/story/2008/05/28/bc-prince-george-fire-ash-health.html
Original URL: http://www.cbc.ca/canada/british-columbia/story/2008/05/28/bc-prince-george-fire-ash-health.html
Tuesday, April 29, 2008
Hockey, Hockey, Hockey
With the Leafs not making the playoffs, I've had an open mind concerning who to cheer for in the playoffs (except for Ottawa, very happy to watch Ottawa loose!). This has changed in round 2. My picks are:
San Jose, Montreal, Pittsburgh and Colorado.
So far, I'm not doing so well. I can't stand Philly and their rude fans. Who boos O'Canada and chants U.S.A. over and over? No respect. Considering a large portion of the team are Canadian Natives - including goaltender Biron - the fans should give their head a shake.
Picked San Jose, as that's where I live now, and the team has good talent. They just need to learn how to perform in the playoffs. Don't really care for Detroit or Dallas.
If trends continue. I guess I'll be cheering for Sid the Kid.
Wednesday, March 19, 2008
Planetary Models.
I've been working on a planetary atmosphere dynamics model for the last while and I've finally made some real progress. Here's a video showing the local vorticity.
Vorticity is a measure of the spin potential.
Vorticity is a measure of the spin potential.
Subscribe to:
Posts (Atom)
