There are about a dozen exosolar planets that transit their host star (a transit is when the planet moves in front of the star blocking out light). Measuring the when transits occur can be a powerful tool to determine if other planets are present in that system.
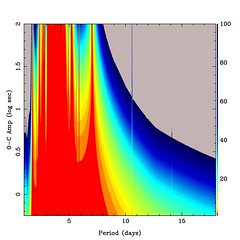
The Figure above shows a simulation of transit timings if additional planets are present. The primary planet has a mass of 0.69 times the Jupiter and an orbital period of approximately 3.52 days. The colours indicate the mass of secondary planet, ranging from 1 to 100 times the mass of the Earth. The scale on the bottom shows the period of the secondary planet ranging from 1 to 17 days. The scale on the left indicates the change in the occurrence of the transit event. It is a log scale (0 -> 1 sec, 1 -> 10 sec, 2-> 100 sec and so on..).
Long term monitoring of transiting systems gives the opportunity to possibly discover other Earth-sized planets outside out Solar System.
Monday, January 28, 2008
Friday, January 25, 2008
Frequency Analysis...
The first process usually done on the time series of a variable star is the frequency analysis. For a star with periods on the order of a day, such as with gamma Doradus types, ground based data can be quite troublesome to work with due to aliasing. The aliasing comes from the day-night cycle of the Earth where a star can only be observed at night. With a spacebased telescope in a proper orbit this problem disappears.
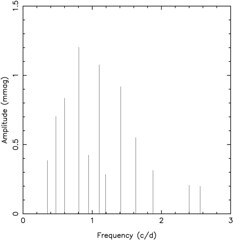
For HR 1613 we obtained 8.5 days of data that is nearly continuous. The result is that we can resolve individual frequencies that compose the lightcurve shape. Mathematically, we want to fit a function consisting of sine curves that have different frequencies, amplitudes and phases. Fitting an equation of this form in a non-linear problem. This means that finding a set of parameters that best fits the data is tricky business.
One method of estimating the best fit parameters is to use a Fourier Transform (in this case, discrete=DFT) to estimate parameters. The method is simple to describe:
1. Perform the DFT of dataset
2. Record the frequency and phase with the highest amplitude
3. use DFT info as guess for fit solution. Then optimize solution.
4. remove solution from original data set to produce residuals.
5. Perform DFT on residuals.
6. Find next highest amplitude.
7. add new frequency to solution and optimize again.
8. repeat 4-7 until there are no significant frequencies remaining in the DFT.
There are some hiccups along the way. The above method does not guarantee that you have found the best solution. Also, your solution parameters may become degenerate if two frequencies are inserted in the solution that are seperated less than the resolution afforded by your observations.
The best way around resolution problems, is to gather more observations! Otherwise, one must be quite careful about claims one may make based on a non-linear model as you may not have found the best solution. The Figure above shows a solution for HR 1613. So far I am not convinced that is a unique solution and it will be very difficult to get new observations. So I'm working on methods to test the uniqueness by efficiently exploring the local parameter space for the model parameters to find other local-minimum/maximum.
Thursday, January 24, 2008
A year later and HR 1613
Argh. I had just finished a lengthly blog entry and then found out that google has changed blogger since the last time I posted (1 year ago!). I guess that will teach me to wait so long between posts.
Anyways, I lost track of blogging as I was busy finishing my thesis, defending, finding a job and moving. Well that's all done now. I successfully defended and submitted the thesis. I am no longer a student. Being a poor grad student was being to really suck, now I can be a not-so-poor poctdoc. As a result, I've moved from Vancouver to San Jose and now work at NASA-Ames with the Kepler project. That alone should give me plenty to chat about in the future.
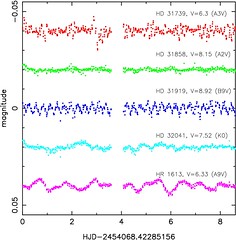
I've been working recently on trying to publish some results on the binary system system HR 1613. The figure above shows an 8.5 days observing campaign from the MOST satellite. The magenta lightcurve at the bottom shows the variability of the stellar system.
The primary, more massive, member of the system is a 1.5 solar mass main-sequency star (A9 V) and the secondary is a less massive and intrinsically less bright K or M-dwarf star. The A9V star shows variability on the time scale of a day. It appears to be gamma Doradus type pulsations. I've discussed these type of pulsations before in my study of the star BD+18 4914. The interpretation is that these are g-modes which may be driven by the star itself or excited by tidal interaction with the companion star.
The other 4 lightcurves show a wide range of stellar activity for different temperatures and mass. The top (red) curve shows a hotter, more massive A-type star which shows variability on the timescale of an hour. These are interpreted as p-mode pulsations and the star is likely a delta Scuti type pulsator. The next (green) curve shows a star with a very similar temperature, but does not show any intrinsic variability. It's evolutionary stage is unknown. The 1 day modulation that you can see by eye in the light curve is an instrumental artifact. It was purposely left in the lightcurve to show its effect on the photometry.
The middle curve (blue) shows a relatively hotter B star. The variability pattern and stellar classification are consistent with being a beta Cephei type star. The next curve (cyan) shows a cooler K-type star. The erratic behaviour in the lightcurve is likely caused by spots on the surface of the star which rotate out of view as the star rotates and change shape as influenced by the stars magnetic field.
Each star shows a unique lightcurve which we can use to probe the internal structure of star, which inturn allows us to infer the star's past and future. It's a very interesting science, to understand the points of light that we see on a clear night.
Anyways, I lost track of blogging as I was busy finishing my thesis, defending, finding a job and moving. Well that's all done now. I successfully defended and submitted the thesis. I am no longer a student. Being a poor grad student was being to really suck, now I can be a not-so-poor poctdoc. As a result, I've moved from Vancouver to San Jose and now work at NASA-Ames with the Kepler project. That alone should give me plenty to chat about in the future.
I've been working recently on trying to publish some results on the binary system system HR 1613. The figure above shows an 8.5 days observing campaign from the MOST satellite. The magenta lightcurve at the bottom shows the variability of the stellar system.
The primary, more massive, member of the system is a 1.5 solar mass main-sequency star (A9 V) and the secondary is a less massive and intrinsically less bright K or M-dwarf star. The A9V star shows variability on the time scale of a day. It appears to be gamma Doradus type pulsations. I've discussed these type of pulsations before in my study of the star BD+18 4914. The interpretation is that these are g-modes which may be driven by the star itself or excited by tidal interaction with the companion star.
The other 4 lightcurves show a wide range of stellar activity for different temperatures and mass. The top (red) curve shows a hotter, more massive A-type star which shows variability on the timescale of an hour. These are interpreted as p-mode pulsations and the star is likely a delta Scuti type pulsator. The next (green) curve shows a star with a very similar temperature, but does not show any intrinsic variability. It's evolutionary stage is unknown. The 1 day modulation that you can see by eye in the light curve is an instrumental artifact. It was purposely left in the lightcurve to show its effect on the photometry.
The middle curve (blue) shows a relatively hotter B star. The variability pattern and stellar classification are consistent with being a beta Cephei type star. The next curve (cyan) shows a cooler K-type star. The erratic behaviour in the lightcurve is likely caused by spots on the surface of the star which rotate out of view as the star rotates and change shape as influenced by the stars magnetic field.
Each star shows a unique lightcurve which we can use to probe the internal structure of star, which inturn allows us to infer the star's past and future. It's a very interesting science, to understand the points of light that we see on a clear night.
Subscribe to:
Posts (Atom)
