Saturday, August 05, 2006

Problem solved...


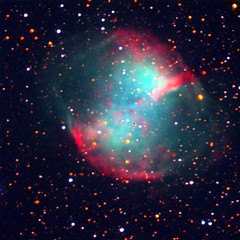
M27 - The Dumbell Nebula
Originally uploaded by Astro Guy.

The photo above is of M27, the dumbbell Nebula. The blue dot in the centre used to like our Sun, but it's now running out of fuel in its core to burn. As this happens outer layers of the star are becoming gravitationally unstable and leave the star driven away by photon pressure and treats us to beautiful sites. The bluish-green gas is due to forbidden transition lines of Oxygen (absorption and emission of photos) and the red gas is due to Hydrogen. One day our Sun will probably do this as well, but don't work thats billions of years away.

The image itself was obtained at the Dominion Astrophysical Observatory (DAO) in Victoria British Columbia. I acquired 3 60 second exposures in B,V and R and then assembled the image you see in front of you.

Now on to my current work:
Today started off lousy, but ended up with a good ending (well, the day isn't over yet).

When I extract photometry from the raw CCD MOST satellite images I usually do not have any dark/flat calibration frames. The dark frame measures both the bias offset and identifies hot pixels on the frame. The flat image is used to measure the differential gain from pixel to pixel. Both of these are important if your target of interest changes position in each image. The MOST satellite seems to have a crack in the side of it. It was probably created during the launch process. This has been a nuisance as it allows stray light (mostly from the Earth itself) to reach the CCD detectors and peaks once per orbit (about 14 times per day). This causes all sorts of problems that I theories to explain, but I'll leave that for another day. The point today, is that I can abuse the stray light to generate local dark/flat fields for each subraster on the CCD. If I assume that the straylight is a uniform source over a 20x20 subraster (good approximation) then I can compare the individual pixel counts compared to the mean. If any pixel increases in brightness faster than the others, this is interepted as a gain difference. Likewise I can measure a zero point (the value of the pixel with no light) which is the dark/bias value.

In practice this works well, especially for dim stars. The problem I've encountered is that the amplitudes of variable stars gets distorted. Initially I thought this was because I was using PSF fitting photometry opposed to pure aperture photometry, but that is not the case. In fact, it's the gain variations that are causing this effect. I never made sure to check that the overall gain corrections come out to 1. In fact they usually come out to about 1.2 or something like that. In other words, I forgot to normalize my flatfield to 1. So simple, Oh well, at least I caught it and have time to make corrections to the datasets for which it is critical! Luckily, absolute amplitudes are usually useless as MOST uses a unique filter (300-700 nm broadband filter!). If anything, it's the relative amplitudes that are important and this is perserved. Plus I have all the raw photometry to compare to as well, so this looks like a bookkeeping exercise.

Thursday, August 03, 2006

Another day, another sunset.


M33 Spiral Galaxy - Scaled!
Originally uploaded by Astro Guy.


The image above was probably the first really cool astronomy picture that I made. My masters research was a carbon star survery of the nearby galaxy M33. Carbon stars are evolved stars that are burning Helium near their cores (shell burning) instead of hydrogen core burning (like our Sun does). Normally these stars are called AGB stars have have atmospheres that are chemically dominated by an abundance of oxygen after the formation of carbon-monoxide. Sometimes, a AGB star will form a double shell energy source with the addition of a hydrogen burning shell. Having to heat sources at different radii from the centre of the star is thermally imbalanced. The star comes almost complete convective and carbon rich material from the core of the star (formed by fusing helium) is transported to the surface of the star. This excess of carbon alters the chemistry of the atmosphere to a carbon dominated state. So in an Oxygen dominated atmosphere (M-star) one can see the formation of molecules such as TiO, whereas in a Carbon dominated atmosphere molecular species such as CN are present. Each of these molecules absorps light at different wavelenghts cause observationally different spectra to be observed.

So, one can build a set of narrow band filters to distinguish between an M-star and C-star. My masters project was to map this ratio around the disc of the nearby (800 Mpc) galaxy M33. It's about the same distance away from us as the Andromedia galaxy (M31). The ratio of C-stars to M-stars (C/M ratio) is a good tracer of the initial metal content of the star. A population of stars formed from metal poor gas is more efficient at forming C-stars than metal rich gas. So we have a tracer of the metallicity of the galaxy and a peak at the history of star formation in a galaxy. All in all, I found about ten thousand C-stars out of 1.3 million stars. It was a lot of work, but we got our result, and I got to make this cool picture from all the data in the end!

and now.. another garbled song...

Time, time, time, sees, what from me it became during I am around
approximate after my possibilities that I was hard therefore with
please however volatile view around, the pages brown looked and the
sky is nebulous nuance of the winter

Wednesday, August 02, 2006

Listening to the stars.


M92 - Globular Cluster
Originally uploaded by Astro Guy.

One always seems to apply that space is quiet. Well, that's true in the sense that sounds needs a medium to travel through (eg. air!). However, sound is also our brains interpretation of the frequencies that we hear. Image that you could interept the light traveling to you from stars as sounds, what would you hear? Normally nothing. A star such as the Sun vibrates with a period of 5 minutes. If you interpret this as a sound, that puts it at a frequency of 0.003 Hz. The average person hears sounds from about 20 to 20000 Hz. We can hear vibrations at a much higher rate.

What makes a star sound interesting, is that there is usually more than one note. This is evident in the fourier transforms of light curve data that I've shown in previous posts where many individual frequencies are present. A star is more like a chord. So lets ramp up the frequencies and listen!

I've done this with some data from the MOST satellite that I've been working with. You can find some of the mp3s here for your listening pleasure. Some of the stars sound like ring sheets of metal, others sound like diseased cat making love (not so nice). You be the judge. If you do download any of the sound files for use be sure to reference the MOST satellite.

In each case I've matched the largest amplitude frequency to 500 Hz and allows the other frequencies to fall as they will.

Tuesday, August 01, 2006

Milky Way from San Pedro Martir


Milky Way
Originally uploaded by Astro Guy.

This has been a week of CPU busy time. Running lots of different models and generating lots of text output. That make a very boring blog entry. So I searched through some of my older photographs and I found this one I took while on an observing run in Mexico. I used 200 ISO film and strapped my camera to the side of the telescope and left the shutter open for about 10 minutes. I was quite excited to see this photo when I developed the film. This is a picture of the Milky Way - our own galaxy. So we are sorta looking at it inside out. The brightest patch in the photo is the direction towards the galactic centre. The dark patches that seem devoid of the stars is actually due to dust that obscures light in the optical part of the spectrum. It's not that there are not any stars there, we just can see them.

I was observing at San Pedro Martir, which is on the Baja California region of Mexico and I spent about 30 days at the summit. It's probably the best site I've been to - better than Hilo in my opinion. You can watch stars rise and set. Not just fade away into the hazy of the atmosphere low on the horizon, but disappear behind land. It was spectacual. You almost feel like the MilkyWay is the only light around you (which is not true..). Can't wait to go back.

The purpose of the observing run was to survey northern Ap stars for variability. To see if they are roAp (rapidilly oscillating) or noAp stars (no oscillations). Currently, almost all roAp stars are found at southern declinations. Everyone seems to believe this is just an observational bias, but every northern survey comes up blank. It's very odd.

roAp stars are known to have pulsation modulation (in FT space you see a spacing of very close frequencies). The model to explain this is called the oblique rotator, where the rotation axis is different from the pulsation axis. Since the non-radial modes are sequencial, the pulsation pattern appears skewed to one pole. As the star rotates this pole will go in and out of view causing the amplitudes of the pulsations to change. I made a movie to show this effect:

roAp Star Movie

The sound is actually from light curve data from an observed roAp star that I've tried to sync up with the movie. It's close, but not bad.

Anyways, with rotation (and magnetic fields!!) one could easily observing stars during pulsation minimum and not pickup the small photometric variations (tenths of a millimag and smaller!). It's a project that just takes patience and lots of telescope time. If it turns out that roAp stars are preferentially found in the South, then the fun begins of explain why!

Lost in Translation.

Having fun with the google translator today, I started to insert lyrics and translate them to various languages and then back to English to see what the final result is.

Here's an easy one to figure out:

The lamp is burnin which is weak according to my table the upper surface which snows it gently tomb the air is still in the rest of my sector than I hear your voice gently naming if I could have you only narrowly a sigh or two to breathe I were fortunately right to hold that with loves of hand I after this precaution of winter with you

(song answer: Song for a Winters Night - Gordon Lightfoot)

This one is a bit more challenging:

For here, I am not it having sat in a box on the world planet mass am far blue
and gives only I can make well that I would be beyond the miles miles hundred
me smells very still and me thinks, my spacecraft know, which manner with my
wife I, they explain outward journey like much them white

(song answer: Space Oddsity - David Bowie)

This could easily entertain me all day, but work to be done.. so back to it.