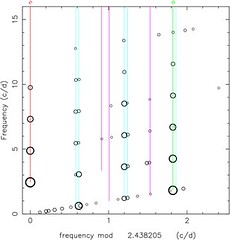
AQ Leo Echelle Diagram.
Originally uploaded by Astro Guy.
A beautiful weekend in Vancouver! Temperatures went above 30C! I've got a nice tan now. Let just hope this lasts a while!
I started fiddling around with echelle diagrams on the weekend. An echelle diagram is a method of displaying evenly spaced frequencies. For instance, with the double mode RR Lyrae star AQ Leo you can extract about 60 significant frequencies from a discrete fourier transform. The y-axis on the diagram plots the frequency, the xaxis shows the phase of the frequency which depends on the folding frequency. For the case of AQ Leo I folded at the frequency of the fundamental pulsation mode (marked as F1 in the diagram). The cyan and magenta lines show where conbination frequencies are expected to occur. Almost all frequencies can be accounted for, except the magenta lines are not quite satifactory. I'm going to investigate if a second overtone pulsation will help matters.

1 comment:
Hey do you know any good place to start learning abt echelle diagrams?
Post a Comment