Crazy Light Curve.
Originally uploaded by Astro Guy.
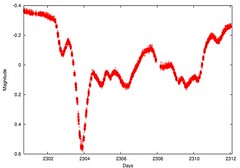
I sat down today and figured out a scheme to fix the correlation between the PSF size and the measured instrumental magnitude. This was very difficult for star shows large variability (like the one in the light curve pictured). So I extracted the low frequency information from the lightcurve and then examined the correlations, fit them and applied them to the original light curve. I iterated the low frequency fitted solution a few times to make sure any instrumental effects did not survive.
The lightcurve above shows a really interesting variable. I don't know the stellar type yet, but my first guess is a B or O class star that frequently show this kind of variability. I'll inquire more about this star tomorrow when everyone is in the office.

1 comment:
So this star is actually pre-mainsequence (PMS) so it hasn't started (or is just starting) to burning hydrogen in the core. It also happens to be in the delta-scuti instability strip and there are delta-scuti frequecies present. These high frequencies are what give the thickness to the line.
Post a Comment