Thursday, September 28, 2006

Layla Barbara Rowe


Layla Barbara Rowe
Originally uploaded by Astro Guy.

My brother is now a dad with a beautiful little girl! The photo on the left is Layla and the photo on the right is my brothers baby photo. It's amazing how much they look alike!

I can wait to get back to Toronto!

dDor/dSct hybrid spectra.


dDor/dSct hybrid spectra.
Originally uploaded by Astro Guy.

Been awhile since I blogged last, been quite busy and haven't had much to say. I did manage to submit a paper on the discovery of a hybrid gamma Doradus/ delta Scuti pulsator. I've talked about this really cool star in the past. I was very interested to get a spectra of the star and get some basic stellar parameters. From a literature search I could only find a sketchy effective temperature of 6500K which was too cool to be placed properely in the observed instability strips.

I contacted DAO and a week later I received the spectra above. The spectra has a resolution of about 20000 centred on H alpha (the big absorption feature in the middle). Even at this medium resolution one can see the rotational broadening of the lines. It's about 35 km/s, well about the instrumental broadening of about 18 km/s. So it's got a significant rotation (this is important!)

Next I computed a grid of Atlas 9 model spectra (Kurucz models) to get an estimate of the effective temperature and surface gravity. The strength of H alpha points to an effective temperature of 7250K and log g = 3.7 cgs. This is much better as it moves this star into the observed delta Scuti and gamma Doradus instability strips. The star is also a bit evolved off the ZAMS. ZAMS stars have log g=4.3.

The next finding was to check the abundance patterns. I've labeled some of the strong elemental lines such as iron. In general the iron lines are observed to be a bit stronger than compared to a solar abundance. The Ca line is also very weak which is an indicator of an Am star. The physical process at play here is diffusion. Some elements are good light absorbers and get pushed to the surface of the star, others are pulled down by gravity. Only elements at the surface of the star (in the photosphere) show up in the spectra as stellar material becomes complete ionized towards the center of the star.

So whats the punchline? Well, the role of diffusion is Am stars is the number or reason for muted pulsations. One needs partial ionization zones to drive the star. Add a bit of rotation and you can counter the effects of diffusion. On top of that there are only 4 hybrid pulsators currently known or which 3 are Am stars and the 4th is binary. Think I've found a neat star to study for a while! Can't wait to learn more.

Saturday, August 05, 2006

Problem solved...


M27 - The Dumbell Nebula
Originally uploaded by Astro Guy.

The photo above is of M27, the dumbbell Nebula. The blue dot in the centre used to like our Sun, but it's now running out of fuel in its core to burn. As this happens outer layers of the star are becoming gravitationally unstable and leave the star driven away by photon pressure and treats us to beautiful sites. The bluish-green gas is due to forbidden transition lines of Oxygen (absorption and emission of photos) and the red gas is due to Hydrogen. One day our Sun will probably do this as well, but don't work thats billions of years away.

The image itself was obtained at the Dominion Astrophysical Observatory (DAO) in Victoria British Columbia. I acquired 3 60 second exposures in B,V and R and then assembled the image you see in front of you.

Now on to my current work:
Today started off lousy, but ended up with a good ending (well, the day isn't over yet).

When I extract photometry from the raw CCD MOST satellite images I usually do not have any dark/flat calibration frames. The dark frame measures both the bias offset and identifies hot pixels on the frame. The flat image is used to measure the differential gain from pixel to pixel. Both of these are important if your target of interest changes position in each image. The MOST satellite seems to have a crack in the side of it. It was probably created during the launch process. This has been a nuisance as it allows stray light (mostly from the Earth itself) to reach the CCD detectors and peaks once per orbit (about 14 times per day). This causes all sorts of problems that I theories to explain, but I'll leave that for another day. The point today, is that I can abuse the stray light to generate local dark/flat fields for each subraster on the CCD. If I assume that the straylight is a uniform source over a 20x20 subraster (good approximation) then I can compare the individual pixel counts compared to the mean. If any pixel increases in brightness faster than the others, this is interepted as a gain difference. Likewise I can measure a zero point (the value of the pixel with no light) which is the dark/bias value.

In practice this works well, especially for dim stars. The problem I've encountered is that the amplitudes of variable stars gets distorted. Initially I thought this was because I was using PSF fitting photometry opposed to pure aperture photometry, but that is not the case. In fact, it's the gain variations that are causing this effect. I never made sure to check that the overall gain corrections come out to 1. In fact they usually come out to about 1.2 or something like that. In other words, I forgot to normalize my flatfield to 1. So simple, Oh well, at least I caught it and have time to make corrections to the datasets for which it is critical! Luckily, absolute amplitudes are usually useless as MOST uses a unique filter (300-700 nm broadband filter!). If anything, it's the relative amplitudes that are important and this is perserved. Plus I have all the raw photometry to compare to as well, so this looks like a bookkeeping exercise.

Thursday, August 03, 2006

Another day, another sunset.


M33 Spiral Galaxy - Scaled!
Originally uploaded by Astro Guy.


The image above was probably the first really cool astronomy picture that I made. My masters research was a carbon star survery of the nearby galaxy M33. Carbon stars are evolved stars that are burning Helium near their cores (shell burning) instead of hydrogen core burning (like our Sun does). Normally these stars are called AGB stars have have atmospheres that are chemically dominated by an abundance of oxygen after the formation of carbon-monoxide. Sometimes, a AGB star will form a double shell energy source with the addition of a hydrogen burning shell. Having to heat sources at different radii from the centre of the star is thermally imbalanced. The star comes almost complete convective and carbon rich material from the core of the star (formed by fusing helium) is transported to the surface of the star. This excess of carbon alters the chemistry of the atmosphere to a carbon dominated state. So in an Oxygen dominated atmosphere (M-star) one can see the formation of molecules such as TiO, whereas in a Carbon dominated atmosphere molecular species such as CN are present. Each of these molecules absorps light at different wavelenghts cause observationally different spectra to be observed.

So, one can build a set of narrow band filters to distinguish between an M-star and C-star. My masters project was to map this ratio around the disc of the nearby (800 Mpc) galaxy M33. It's about the same distance away from us as the Andromedia galaxy (M31). The ratio of C-stars to M-stars (C/M ratio) is a good tracer of the initial metal content of the star. A population of stars formed from metal poor gas is more efficient at forming C-stars than metal rich gas. So we have a tracer of the metallicity of the galaxy and a peak at the history of star formation in a galaxy. All in all, I found about ten thousand C-stars out of 1.3 million stars. It was a lot of work, but we got our result, and I got to make this cool picture from all the data in the end!

and now.. another garbled song...

Time, time, time, sees, what from me it became during I am around
approximate after my possibilities that I was hard therefore with
please however volatile view around, the pages brown looked and the
sky is nebulous nuance of the winter

Wednesday, August 02, 2006

Listening to the stars.


M92 - Globular Cluster
Originally uploaded by Astro Guy.

One always seems to apply that space is quiet. Well, that's true in the sense that sounds needs a medium to travel through (eg. air!). However, sound is also our brains interpretation of the frequencies that we hear. Image that you could interept the light traveling to you from stars as sounds, what would you hear? Normally nothing. A star such as the Sun vibrates with a period of 5 minutes. If you interpret this as a sound, that puts it at a frequency of 0.003 Hz. The average person hears sounds from about 20 to 20000 Hz. We can hear vibrations at a much higher rate.

What makes a star sound interesting, is that there is usually more than one note. This is evident in the fourier transforms of light curve data that I've shown in previous posts where many individual frequencies are present. A star is more like a chord. So lets ramp up the frequencies and listen!

I've done this with some data from the MOST satellite that I've been working with. You can find some of the mp3s here for your listening pleasure. Some of the stars sound like ring sheets of metal, others sound like diseased cat making love (not so nice). You be the judge. If you do download any of the sound files for use be sure to reference the MOST satellite.

In each case I've matched the largest amplitude frequency to 500 Hz and allows the other frequencies to fall as they will.

Tuesday, August 01, 2006

Milky Way from San Pedro Martir


Milky Way
Originally uploaded by Astro Guy.

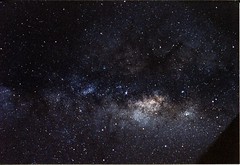
This has been a week of CPU busy time. Running lots of different models and generating lots of text output. That make a very boring blog entry. So I searched through some of my older photographs and I found this one I took while on an observing run in Mexico. I used 200 ISO film and strapped my camera to the side of the telescope and left the shutter open for about 10 minutes. I was quite excited to see this photo when I developed the film. This is a picture of the Milky Way - our own galaxy. So we are sorta looking at it inside out. The brightest patch in the photo is the direction towards the galactic centre. The dark patches that seem devoid of the stars is actually due to dust that obscures light in the optical part of the spectrum. It's not that there are not any stars there, we just can see them.

I was observing at San Pedro Martir, which is on the Baja California region of Mexico and I spent about 30 days at the summit. It's probably the best site I've been to - better than Hilo in my opinion. You can watch stars rise and set. Not just fade away into the hazy of the atmosphere low on the horizon, but disappear behind land. It was spectacual. You almost feel like the MilkyWay is the only light around you (which is not true..). Can't wait to go back.

The purpose of the observing run was to survey northern Ap stars for variability. To see if they are roAp (rapidilly oscillating) or noAp stars (no oscillations). Currently, almost all roAp stars are found at southern declinations. Everyone seems to believe this is just an observational bias, but every northern survey comes up blank. It's very odd.

roAp stars are known to have pulsation modulation (in FT space you see a spacing of very close frequencies). The model to explain this is called the oblique rotator, where the rotation axis is different from the pulsation axis. Since the non-radial modes are sequencial, the pulsation pattern appears skewed to one pole. As the star rotates this pole will go in and out of view causing the amplitudes of the pulsations to change. I made a movie to show this effect:

roAp Star Movie

The sound is actually from light curve data from an observed roAp star that I've tried to sync up with the movie. It's close, but not bad.

Anyways, with rotation (and magnetic fields!!) one could easily observing stars during pulsation minimum and not pickup the small photometric variations (tenths of a millimag and smaller!). It's a project that just takes patience and lots of telescope time. If it turns out that roAp stars are preferentially found in the South, then the fun begins of explain why!

Lost in Translation.

Having fun with the google translator today, I started to insert lyrics and translate them to various languages and then back to English to see what the final result is.

Here's an easy one to figure out:

The lamp is burnin which is weak according to my table the upper surface which snows it gently tomb the air is still in the rest of my sector than I hear your voice gently naming if I could have you only narrowly a sigh or two to breathe I were fortunately right to hold that with loves of hand I after this precaution of winter with you

(song answer: Song for a Winters Night - Gordon Lightfoot)

This one is a bit more challenging:

For here, I am not it having sat in a box on the world planet mass am far blue
and gives only I can make well that I would be beyond the miles miles hundred
me smells very still and me thinks, my spacecraft know, which manner with my
wife I, they explain outward journey like much them white

(song answer: Space Oddsity - David Bowie)

This could easily entertain me all day, but work to be done.. so back to it.

Friday, July 28, 2006

Gamma Doradus Star


Gamma Doradus Star
Originally uploaded by Astro Guy.

Another day, another neat light curve. Here is 44 days of continuous photometry of a gamma Doradus star. The top panel shows the DFT (amplitude, not power!) and the bottom panel shows the light curve binned by 40 minute intervals. The gamma Doradus stars are a relativity new class of variable stars found in the classical instability strip. They commonly have low amplitudes (4 mmag for this star!) and periods around 1 day, which makes them difficult to pick up from the ground. The low frequency comment (~1 c/d) are thought to be high-n, low-l g-mode (gravity is the restoring force). This star also shows delta-Scuti like pulsations around 9 c/d. Quite and interesting star and will serve well to test current ideas, such as mode identification schemes!

Thursday, July 27, 2006

Spherical harmonic animation.


Spherical harmonic animation.
Originally uploaded by Astro Guy.

So I'm still working on models to explain some extraneous frequencies in the echelle diagram for AQ Leo. The application of non-radial modes has been suggested - although I'm not really a fan. I think the science is more interesting just in explaining the existence of combination frequencies.

Well, to investigate the non-radial suggestion, one has to work with spherical harmonics, which are a set of solutions to Laplace's equation and are handy for decomposing pulsation modes in stars into a series of numbers. If you click on the photo above you'll be linked to my flickr account. Click on the "all sizes" button above the picture, and you'll get to see the animation of a pulsation mode described by the spherical harmonic of l=5, m=2. Of course a star does not pulsate with such large variations, but only a fraction of a percent of the radius, but it's much cooler to see the deformations amplified.

So now I'm inserting non-radial modes by brute force to see what kind of light curve is produced with the addition of rotation and radial pulsations. I don't expect to see anything dramatic, because the important physics is missing.. namely, boundaries and assymetrics within the star. Since an RR Lyrae is a helium burning horizontal branch star the pulsation should travel through convective and radiative zones. You dump a non-radial mode at a transition zone and the radial pulsation becomes preterbed, possibly setting up a standing wave from interference. In photometry this will show up as combination frequencies.

This is definitely work in progress.

Tuesday, July 25, 2006

AQ Leo Echelle Diagram.


AQ Leo Echelle Diagram.
Originally uploaded by Astro Guy.

A beautiful weekend in Vancouver! Temperatures went above 30C! I've got a nice tan now. Let just hope this lasts a while!

I started fiddling around with echelle diagrams on the weekend. An echelle diagram is a method of displaying evenly spaced frequencies. For instance, with the double mode RR Lyrae star AQ Leo you can extract about 60 significant frequencies from a discrete fourier transform. The y-axis on the diagram plots the frequency, the xaxis shows the phase of the frequency which depends on the folding frequency. For the case of AQ Leo I folded at the frequency of the fundamental pulsation mode (marked as F1 in the diagram). The cyan and magenta lines show where conbination frequencies are expected to occur. Almost all frequencies can be accounted for, except the magenta lines are not quite satifactory. I'm going to investigate if a second overtone pulsation will help matters.

Thursday, July 20, 2006

M51 - Spiral Galaxy


M51 - Spiral Galaxy
Originally uploaded by Astro Guy.

I made this photo a couple years back now. I got the observations at the Dominion Astrophysical Observatory (DAO) in Victoria British Columbia with 60 second exposure times in B,V and R filters. I'm in a rush out the door, so I'll comment more on this tomorrow.

Tuesday, July 18, 2006

Jupiter on July 3rd 2006


Jupiter on July 3rd 2006
Originally uploaded by Astro Guy.

Just over two weeks ago I sat down and figured out how to couple by digital camera to my little telescope. I have two cameras. A 35mm canon rebel (takes great shots, uses film) and a digital elph 3D300 also by Canon. This discussion involves the later.

I've seen some neat images of planets created by webcams to a lesser extent by digital cameras. The idea is to mount the camera in front of the eyepiece and project the image on to the detector. This can work quite well for bright objects. For an object like the moon, you can simply point the telescope and then hold the camera with your hands in front of the eyepiece. Once you find the right angle, the moon will show up on the LCD screen. So click away. You can get some cool results!

Planets can be a bit more tricky. I have succeeded in imaging Saturn and Jupiter by hand holding the camera, but this is not ideal as even the steadiest hand will shake. The trick to getting a good image is to combine multiple images. So to help make this easier I pulled out the toolbox. I used an L-bracket and a clamp to hold the camera in front of the eyepiece. I have a f4.5 3inch refractor and I used a 2.5mm long relief eyepiece - the long relief really helps.

At this point I aim the telescope at Jupiter and put the camera into video mode. I recorded at 30 frames/sec for 30 seconds. Next I transfer the AVI on to my computer using gtkcam on Linux. I can convert the AVI into individual PNG images with the mplayer software (just use -vo png). These png images can then be converted into FITS images for the 3 seperate colours with the image magick software "convert". I use FITS format as I do astronomy CCD processing with IRAF. In IRAF you can use the immatch.xregister program to remove any x-y offsets and allign all the frames. The key parameters are to set dxlag and dylag to INDEF to use the x-y shifts from the previous image and to set regions parameter to bracket planetary image.

Once you have a set of alligned images, I compute the average of the all the frames in each colour with imcombine. This gives you a single image for each bandpass (blue, green and red). To make the final colour image, I loaded each fits file with The Gimp and made a colour composite. Then I played with the brightness levels and so forth to bring out some detail. You can see my final product above.

To really improve the image, I like to get my hands on a video capture device that outputs RAW data. No MPEG/JPEG compression. The compression routines kill fine detail. I think I could do a much better job with raw images. I've been investigating webcams, but I don't know much about right now (and I'd like one that works with Linux).

Sunday, July 16, 2006

M55 Blue Stragglers.


M55 CMD
Originally uploaded by Astro Guy.

This is a colour brightness plot (more commonly known as a colour-magnitude diagram or CMD) of stars in the globular cluster M55.
The black dots show the measurements for each star. There is probably about 4000 data points. Overlayed are various models that describe the age of the cluster.

A globular cluster is a great object to understand the evolution of stars. All stars in the globular cluster were born at the same time - around 13 giga-years (Gyr) ago (that's 13 000 000 000 years ago!). The more massive the star, the faster it burns hydrogen. As the hydrogen fuel source runs out, the structure of the star changes. This can be observed as change in colour and brightness. So the 0.1 Gyr line on the plot shows what the diagram would look like 100 million years have the birth of all the stars. The 13 Gyr line does a good job describing what the cluster looks like to us now. For dim stars (V less than 20) you can see that all the model tracks match. These stars,
because of their low mass, evolve very slowly, where as all the bright
massive stars are gone. By locating what is known as the cluster turn off (the bend in the data points at V=18, V-R=0.4) we can estimate the age of the cluster.

Now all this is well known, but what interests me are the data points that have squares and triangles around them. The triangles are RR Lyra stars, like AQ Leo I talked briefly about in a previous post. The squares are pulsating blue stragglers. They are metal poor delta scuti stars in the cluster. The problem, is that these don't match the age of the cluster. The isochrones (the model lines) show ages less than 4 Gyr. These stars are massive enough that if they were the age of the cluster they would of ceased core hydrogen burning a long time ago. They seem to be evolving too slow, hense the same Blue Stragglers.
(Side note: Originally abbrivated as BS --whoops-- are now seen as BSs in literature)
There are two theories to explain the existance of BSs:
1. Captured from the Halo/Disc of the Milky Way as the globular cluster oribits the galaxy.
2. Two stars collided and merged. (most like a binary system through three body interaction)
Each may be pauslible. My idea is to match the pulsation frequencies of the variable stars to different models with different characteristics - such as composition and rotation and see if the results are consistent with either of the two theories. There is also the possibility that both are correct. Should be exciting.

Saturday, July 15, 2006

Interesting...


Interesting...
Originally uploaded by Astro Guy.

Finished another dataset today and this interesting variable turned up! (The x-axis is in days and and the y-axes is in magnitudes).
The white points are the data and the red line is a fit to the 20 strongest frequencies in the fourier transform.
The the "blips" that occur every 5 and bit days is the interesting part! There is also a significant frequency at 3 c/d that has an amplitude of about 500 part per million (yeap,, you heard that right) which gives it a S/N greater than 5 in fourier space.

Another star to put on my "What is the stellar type?" list.

I personally like to reduce datasets blindly. So I don't introduce any personal bias, but I always hate the 1-2 day wait to get the HD number and see what this baby is!

The little town of Verrieres is one of the prettiest in Franche-Comte.


Book for blog.
Originally uploaded by Astro Guy.

Well, not every entry is going to be complete science related. Afterall, a person needs to have a life! I take the bus onto campus everyday and it takes about 45 minutes one-way. This gives me 1.5 h of "quiet" reading time everyday. I've developed a habit of always reading on the bus and I rarely pay attention to what is going on around me. Every now and then I'll forgot by book in the office or at home. In these cases I usually stare out the window and I'm always amazed at the changes that take place. Most of this change is due to construction, and I'll remark to myself, "Hey, that building wasn't there before...".

I just finished reading Scarlet and Black by Stendhal (at least that's the name he assumed for writing the book). It's always commented on as being good representation of France after the revolution (when the story takes place), but I was more capitivated by the hero of the book, Julien Sorel and his story. I think I pitied him more that critics due and as such, enjoyed it more (but what do critics know anyways, this is opinion). This is one of these books that I will hold on to for now to read again later. I usually give to give a book away after I've read it. I'll list this one in my top ten.

Friday, July 14, 2006

MOST satellite detects planetary transit.


MOST satellite detects planetary transit.
Originally uploaded by Astro Guy.

I'm in the middle of finishing a paper on the albedo measurements of an extrasolar planet; HD 209458b. I've been playing with the data for about 6 months. I'm reaching the point of blind hatred. I'll feel much better once I finish the draft of my paper.

I gave talk in Calgary about the work I've been doing on this system, which includes full photometric reductions of about 500 000 CCD frames and fitting for the albedo. The albedo of the planet can be detected by watching the contributed light from the planet change during the orbital cycle. So I watch the planet change phases. It is brightest when fully illuminated by the star (like the full moon) and dimmest when looking at the night side (like a new moon). The planet as transits (goes in front) and is eclipsed (goes behind) its parent star. The transit causes a 2% dip on the light curve as seen in the figure above. The eclipse depth is equal to the amplitude light variations caused by phase changes, which is about 1/20000. So we need stable photometry better than 0.05 mmag over 40+ days of photometry. This can only be done from space.

As I switch from data-reduction monkey mode into paper writing mode, my blogs will entail my writing experience and how progress is going.

Wednesday, July 12, 2006

Subpixel Sensitivity


Subpixel Sensitivity
Originally uploaded by Astro Guy.

I spent most of the day work on better routines to handle partial pixels in aperture photometry. Usually, a simple approximation is used to calculate the contribution of pixels at the aperture boundary. These approximations can add systematic errors to extracted photometry. So I decided to actually integrate each pixel with exact formulae. This ended up being a logic brain bomb. Lots of if statements, but in the end it works. Time to test it out. I also want to include a bilinear pixel interpolation scheme to take into account the slope of the PSF when using small radii. I'll attack that tomorrow.

Now some real issues when dealing with CCD images. The figure shows the dependance of the measured instrumental magntitude as a function of the PSF centroid. There is a clear dependance. Since the PSF is unsampled (FWHM < 2 pixels) the CCD filling factors come into play and have to be corrected for. That'll be an exercise for next week.

Tuesday, July 11, 2006

V471 Tau


Eclipsing System.
Originally uploaded by Astro Guy.

Here is a beautiful light curve for the binary system V471 Tau. It consists of a main sequence star (K2V) and a hot white dwarf (DA). The dip at phase 0.25 is when the white dwarf passes in front of the main sequence star. The overall pattern is due to tidal distortions of the main sequence star (gravitational interaction with the white dwarf) and the occurance of star spots.

Sunday, July 09, 2006

Figured it out...


Crazy Light Curve.
Originally uploaded by Astro Guy.

I sat down today and figured out a scheme to fix the correlation between the PSF size and the measured instrumental magnitude. This was very difficult for star shows large variability (like the one in the light curve pictured). So I extracted the low frequency information from the lightcurve and then examined the correlations, fit them and applied them to the original light curve. I iterated the low frequency fitted solution a few times to make sure any instrumental effects did not survive.

The lightcurve above shows a really interesting variable. I don't know the stellar type yet, but my first guess is a B or O class star that frequently show this kind of variability. I'll inquire more about this star tomorrow when everyone is in the office.

Saturday, July 08, 2006

Another problem...


Another problem...
Originally uploaded by Astro Guy.

The new observing scheme with the MOST satellite is already cause problems for me. This plot shows the correlation between the PSF size and the instrumental magnitude. Time to start hitting the source code and see if I can figure out what is going on.

AQ Leo with the MOST Satellite


AQ Leo with the MOST Satellite
Originally uploaded by Astro Guy.

This has been a good week. I've managed to figure out how to decorrelate the stray light signal from large amplitude pulsators. The attached image shows a 2 day blow up of a 35 day observing run on the double mode RR Lyra AQ Leo. It's an impressive target. The fourier transform shows over 30 frequencies which all be related to harmonics or combination frequencies of the main two modes (fundamental and first overtone). Now I'm racking my brain over a physical explanation for the combination frequencies - shock waves come to mind, but a difficult to model. I'll have to keep thinking about it.

Thursday, June 08, 2006

Back in the office....

Okay, I just got back from Calgary. I always make a point to attending the annual CASCA (Canadian Astronomical Society) meeting. You get about 200 astronomers together to share news about the latest work that they are doing, and it's also a great social venue to interact and meet other astronomers across the country. I have never had a bad time at a CASCA meeting. My one rule is, no matter how late at night I party till, I have to make the first talk in the morning. I haven't been 100% successful, but better than others!

I decided to drive to CASCA this year as it was in Calgary and I live in Vancouver. It took about 13 hours one way. You can do the drive much quicker, but I wanted to make stops along the way and take lots of pictures.